Tagged: Montreal
You say you want a Revolution – A different angle on PWP and Team Performance
A superb run with five wins and a draw in six games; by most standards that is a compelling argument for consistency. I agree and their overall Composite Possession with Purpose Index rating continues to climb.
They’ve (New England) climbed from 17th in PWP (week 5) to 7th after week 11; a superb shift of 10 full places in 6 weeks.
So in considering this giant push forward I’d like to take a different approach in how the data points from PWP can be viewed.
This is new so please bear with me for a minute or two as I set the context.
Below are a number of diagrams referencing my PWP indicators for a few teams; the diagram being used this time is the ‘doughnut’ diagram from Microsoft Powerpoint.
The interesting thing about this diagram is that it allows me to offer up a view on my PWP data points that isn’t relative to the exponential relationship (a line). Instead, it allows me to picture the overall tenor of PWP data points in relationship to themselves as being a part of a ‘whole’; with the ‘whole’ being PWP.
I feel confident I can take this approach since my Expected Wins 2 correlation for my data points is ~.97 (R2) — as near to rock solid as you can get.
Other context points include:
- The teams used in this analysis are Seattle, New England, Montreal, Portland and last years’ Supporters Shield winner (New York) plus last years bottom dweller (DC United)
- Reminder in case my explanation was a bit wordy above – the percentages indicated in the doughnut are not the percentages of those activities relative to the game; they are the percentage of those activities relative to each other with 100% being all those activities added together.
- Source – as usual the MLS Chalkboard and the MLS Statistics Sheets
- Gold Stars on the diagrams are intended to show you where differences occur.
- The team name on the outside of the doughnut is the outer ring of data and the team name on the inside of the doughnut is the inner ring of data.
To begin…
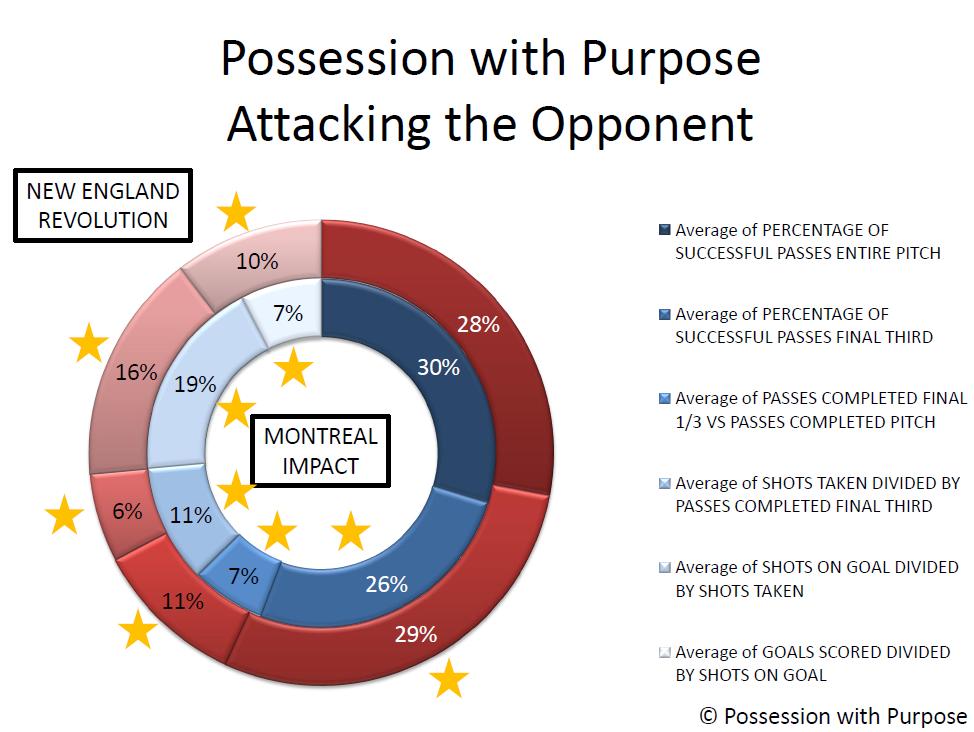
PWP Doughnut Diagram Week 11 NER v MIFC
The volume of Final Third passes successfully completed by New England (29%) is 3% points higher than Montreal (26%). Note also that Montreal has a greater percentage of PWP outside the Final Third (30%) than New England (28%). Both of these indicate to me that New England is more focused on penetrating and creating than Montreal.
For the future I will check into these three areas when looking to see if a ‘direct attacking approach’ can be better differentiated from a ‘ground-based’ (short passing scheme) approach.
The actual volume of penetration is higher for New England as well (11%) versus (7%). And like my regular PWP analysis the data here also supports the fact that teams who are more patient in creating shots taken (6% for NER versus 11% for MIFC) end up with more goals scored.
I did ask Matthias Kullowatz about the specific shot data for New England and Montreal; ~60% of Montreal’s shots on target have come outside the prime scoring zones 1 & 2 while ~68% of the Revolution shots on target have also come outside of zones 1 & 2. So what’s different?
I think it’s down to time and space again; though it could be the Revolution have better strikers – but when you see the DC United doughnut diagram a bit later I think it’s back to time and space; and with fewer shots taken and more patience in the final third that seems reasonable to me.
Now for a contrast that might be better at explaining individual mistakes and bad fortune more than a bad ‘style/system’…

PWP Doughnut Diagram Week 11 SSFC v PTFC
Notice no ‘gold stars’; why? Because there really isn’t that much difference between how these two teams execute the six steps of PWP.
What separates these two teams in the league table are individual mental mistakes in defense – Portland sit on ten points while Seattle have 25. Through the course of this year the Timbers have dropped 7 points due to red cards and penalties – they did both against Columbus Saturday night!
In considering the ‘sameness’ of the data I expect as time passes an output similar to this could highlight ‘individual mistakes’ and perhaps ‘good/bad luck’ when it comes to rebounds and deflections – again recall Saturday night when Futty Danso deflected a shot and notched an ‘own-goal’
All told things went pretty well for Columbus, a red card by their opponent, a foul in the penalty box by their opponent for a PK and a deflected own-goal by their opponent. If I were a Columbus fan I’d be pretty pissed they didn’t win – bad luck for the Crew!
However viewed I’ll revisit this diagram later when the Cascadia Cup battle heats up.
So here’s the doughnut view of New York compared to DC United last year and then a bit further down how they look compared to each other this year.

PWP Doughnut Diagram NYRB v DCU 2013
First off – let’s not forget Ben Olsen was not fired and perhaps this doughnut diagram can also help explain why given the overall poor performance in results last year for DC United.
Notice that the team does exceedingly well in comparison to New York with respect to Passing, penetration and creation; they actually exceed New York in the first two categories and only fall off when it comes to goals scored (7% for DC United versus 15% for New York).
So I’d offer that the system Ben Olsen ran last year worked – what he lacked was a pair of good strikers. And if you recall the Montreal doughnut earlier the outputs from DC United do not mirror those of the Impact!
They added Espindola and Johnson and shored up their defense a bit; that also included adding Amos Magee to the staff. Remember him as the Defensive Coordinator for Portland last year (I think – others can confirm or deny that I’m sure)
Bottom line here – the system didn’t change and the Head Coach didn’t change and I’d offer that was appropriate… now for the same diagram this year:

PWP Doughnut Diagram Week 11 NYRB v DCU 2014
In closing:
Note the increase for DC United in the final category – goals scored versus shots on goal – pretty compelling information to reinforce that the system used last year is the same system used this year and the difference – major difference – is the addition of two quality strikers.
I’m just in the learning stages on how this new doughnut diagram will take shape – I’m pretty sure it will have at least one hole in it – I’m hopeful there aren’t a lot more.
Some changes afoot with OPTA and MLS – I see OPTA incorporated the Final Third Passing Accuracy suggestion – just need to find out if crosses are included in that metric???
As for the new MLS Chalkboard – I’m not sure how that will work if the ‘numbers’ of activities are not available to count when it comes to defensive activities and ‘touches’ for players…
And yes, the old Chalkboard still appears to exist given a separate link within previous articles but it’s unclear if this change will be a permanent change for next year – or even the World Cup for that matter…
As for This Week in PWP; if you saw my tweets yesterday you know the top Attacking and Defending PWP teams of the week; New England in attack and Toronto in Defense with the Reds taking the Composite PWP Index top spot for Week 11.
Sporting KC, along with LA Galaxy remain atop the Composite PWP through Week 11 while the Revolution moved to 7th and Columbus dropped to 4th as Real Salt Lake are now in a comfortable position of 3rd best overall.
Finally, this view also gives you and idea of what percentage each team gleans from each of the PWP Six Steps data points in the calculation for the overall Index number.
Best, Chris
MLS Soccer – Week 14 – The best and worst in Possession with Purpose
Been a really busy past two weeks for me and it’s good to nestle back into a routine offering for your consideration. That being said I should appropriately note that I met some really superb people this past week at the World Conference on Science and Soccer.
It’s a small world when you meet someone who knows where Thetford, England is – and – has been there before!
Anyhow, I digress, back to American Major League Soccer and the results of Week 14.
There were plenty of surprises again this week, parity gone wild I suppose and none greater for most than Chivas, of all teams, drawing at home, erh, on the road, erh, at home on the road, against LA Galaxy; I’ll bet Arena was pretty upset with that result!
Not to be outdone, New York took three points from New England while Portland finally got a win in Rio Tinto (their third straight road win!) and Sporting spanked spurting Houston.
So who, exactly, after all those games, was the best of the best in attack?

APWP Index Week 14 MLS
Vancouver – aye – three goals on the road in Philadelphia saw them just edge out Portland by less than a hundredth of a point – the final difference really came down to having fewer shots on goal while scoring the same amount of goals.
It’s interesting to see that both teams actually had less than 50% of the possession.
In a side discussion, at the WCSS last week, we talked whether or not the Index had a bias towards possession; most seemed to agree that the bias in PWP is towards ‘accuracy’ and perhaps ‘goals scored versus shots on goal’; not possession.
On the bottom end was San Jose, the prototypical direct attacking team, who scored no goals even though 18% of their 11 shots taken were on goal. Of course that shouldn’t be a surprise though – San Jose are not very good on the road this year – taking just 4 points out of their current 16. More later on their passing accuracy as well…
So how did things go on the defending side of the ball?

DPWP Index Week 14 MLS
The top defending team this week was DC United; holding a very powerful possession based team, Columbus, who had just 10 shots taken with only 2 testing Bill Hamid; bottom line here is that draw for Columbus saw both Toronto and New York leap-frog them into the top five; it probably didn’t help not having Higuain running the attack.
However viewed the real difference maker between Toronto and DC United really came down to DC United playing against a more possession based team who is routinely very accurate in their passing; averaging 79.99%; the best in MLS at this time. Well done DC United!
Another view is that Toronto was playing against San Jose who was, this week, 3rd worst in overall passing accuracy this week and 2nd worst in passing accuracy after penetrating the Toronto Final Third.
And since we know that Toronto yields the greatest volume of opponent passes in their own defending third it’s a pretty pathetic performance when converting just 53.08% of those passes.
As for the worst in defending this past week; Philadelphia takes the honors.
Vancouver had just 42.11% of the possession while being 5th worst in Final Third Passing Accuracy but they were completely dominating when it came to putting shots on goal and goals scored; 67% and 75% respectively.
In looking at the Composite Possession with Purpose (CPWP) Index….

CPWP Index Week 14 MLS
For the first time this year Portland has taken those honors – how did they do it? A good article to read that peels that back a bit is here… some other thoughts not included are…
They had less possession yet were 2nd best this week in passing accuracy across the entire pitch and 3rd best in passing accuracy within the attacking final third.
In addition, Portland put 82% of their shots on goal and scored on 33% of those.
Bottom line on this effort was taking advantage of space and leveraging an increasingly dangerous Fenando Adi; a true target #9 with nous and deceptively brilliant foot/heading skills!
Saying that is not to diminish the value of Sporting and New York also taking 3 points on the road; it was incredible to see New York defeat a very strong home side in New England.
No-one this year has been better at home compared to on the road – and all that without Thierry Henry and Tim Cahill; while also nursing a much-maligned Red Bull back-four. I wonder if we see Ibrahim Sakagya play central defending midfielder again this year?
As for Sporting KC hadn’t won a game since May 10th against Montreal – so that 2-nil win at BBVA Compass Stadium had great value.
That being Houston is not the team some might think they are. Their current points total is deceptive; they have played 16 games and have taken just 17 points. Montreal might be at the bottom of the league standings – but when it comes to the overall CPWP through Week 14 they are higher and they have four games in hand against both Philadelphia and Houston…
Might Frank Klopas be getting things better organized as the mid-point in the season draws near? I imagine he needs to; it can’t be easy replacing the Head Coach who actually got the Impact into the Playoffs, last year, at the expense of the team you just got fired from.
In closing…
We are nearing the mid-season point and the overall Composite PWP continues to take shape.
For me, it’s still too early to try and leverage PWP as a predictive model (need at least 17 games for each team really) – that being said I might have to purge Goals Scored from the Index to really put it to test – I’ll do that after week 20 and see what the Expected Wins relationship looks like…
Best, Chris
Next Up – MLS Soccer – PWP through Week 14 – Tomorrow…
