Category: Expected Wins
Redefining and Modernizing Total Shots Ratio
For many years Total Shots Ratio has plodded along as a good indicator of team shooting performance, not overall team performance, but shooting performance.
It’s a good enough indicator that its found its way into generic match reports for professional soccer teams and has good visibility on Opta – a well recognized soccer statistics company now owned by Perform Group.
But with all that publicity and ‘useability’ that doesn’t make it ‘right’!
Why do I say that?
Within a game of football there are always two teams playing against each other – so team performance statistics should not only take into account what the attacking team is doing – they should also take into account what the opponent is doing to the attacking team.
So what do I mean about modernizing TSR. Most define TSR has simply the volume of shots one team takes versus the volume of shots another team takes. That’s okay but the end state is excluded – the result – a goal scored.
So my new vision of TSR centers around the end state as well as the volume – in other words the equation for Attacking TSR (ATSR) now becomes Goals Scored/Shots Taken and then Defending TSR (DTSR) becomes the percentage of your opponent’s Goals Scored/Shots Taken.
Finally, in looking at how well Composite Possession with Purpose correlates to Points Earned in the League Table I would create Composite TSR (CTSR).
Before getting to the numbers – some history first:
I built Possession with Purpose using this philosophy and if you’ve been following my efforts for the last two years you know that my correlations to points earned in the league table are extremely high… To date:
- MLS 2014 = .86
- Bundesliga = .92
- English Premier League =.92
- La Liga =.91
- UEFA Champions League =.87
So let’s peel back the regular way TSR correlates to Points earned in last year’s MLS – when viewing the old way (Total Shots only as a percentage for both teams) the Correlation Coefficient “r” for the entire league was .32.
My new way of calculating CTSR with the End State of Goals scored has a correlation coefficient “r” of .75
Far higher… now for some data.
Here’s the correlation of the my new TSR Family of Indices shows with respect to Points Earned in the League Table – the same analyses used with respect to CPWP above:
- MLS 2014 ATSR .74) DTSR (-.54) CTSR (.75)
- Bundesliga ATSR (.53) DTSR (-.41) CTSR (.68)
- EPL ATSR (.86) DTSR (-.35) CTSR (.76)
- La Liga ATSR (.88) DTSR (-.77) CTSR (.92)
- UEFA ATSR (.64) DTSR (-.40) CTSR (.65)
Like CPWP the correlations vary – in four of five competitions the CTSR has a better correlation to points earned in the league table – while in one case (the EPL) ATSR has the best correlation.
So how do the numbers stack up for some individual teams when evaluating ATSR, DTSR, CTSR, and CPWP compared to those teams points earned throughout the season?
In other words what do the correlations look like (game to game) through the course of a season for sample teams within each of those Leagues?

In almost every sample TSR (now ATSR) has a lower, overall correlation to a teams’ points earned in the League Table than CTSR (Borussia Dortmund and Barcelona being the exception) – this pattern follows the same pattern seen with CPWP almost always having a higher correlation than APWP and Goal Differential almost always having a higher correlation than Goals Scored.
I’ve also taken the liberty of highlighting which Composite Index has the best correlation to points earned between all four categories – in every instance either CTSR or CPWP is higher than TSR. But, as can be seen, sometimes CTSR is higher than CPWP…
What this proves is that there simply isn’t one Index that is far better or far worse than the other – it shows that different teams show different styles that yield better relationships to points earned in different ways —> meaning there is not only room for improvement in current TSR statistics but room for the inclusion of PWP principles within the Industry standard.
I would offer – however – that even when you create CTSR the backbone of that data can’t offer up supporting analyses on how a team attacks or defends. It’s still only relevant to the volume of shots taken and goals scored.
And while the volume of shots on goal and goals scored appears to be a constant across most competitive leagues (average greater than 5 and 2 respectively for teams winning on a regular basis) the average of shots taken for winning teams is not as constant… (Expected Wins 4) —> why I favor PWP over TSR – nothing personal – just my view…
In Closing:
I’m not sure I did a good job of comparing what I view as the old way to calculate TSR (the way that ignores the End State of Scoring a goal) and how an update to it can help tell a better story that actually correlates better to the complexities of soccer.
Best, Chris
COPYRIGHT, All Rights Reserved. PWP – Trademark
Expected Wins Five – Europe
In my previous series on Expected Wins Four – probably more appropriately entitled “Expected Points” – I’d taken a look at how the general tendencies of four primary Leagues in Europe (England, Germany, Spain, as the UEFA Champions League) compare to Major League Soccer – Is European Football Really Higher Quality than Major League Soccer?
This time I’m focusing strictly on Europe and offering up how things stand in PWP with the season coming to a close soon. But before digging some things to share about PWP to date:
A reminder – PWP is about two things:
- The End State in that the final Index comes as close as possible to the League Table without using points earned in any of the calculations, and
- Recognizing that soccer is a game that is played in a free flowing environment – picture two amoeba fighting against each other in a confined space…. There is attempted control by the Head Coach that includes tons of preparation to set the stage for ‘an approach’ to earn three points – and then there is the game itself where there is but one time out (halftime) – no namby pamby huddles or official stoppages of play between possessions. Meaning these guys play a full-on, in your face (sometimes literally), non-stop, constantly thinking and reacting to the game that can literally see the ball go in any direction at any time… not purely random but close.
Given that, PWP attempts to tone down all that volatility and parse out general tendencies that fall within the bell curve of activities – it’s not perfect – but it’s bloody good… and yes – I have made a few mistakes along the way (if you don’t work you don’t make mistakes). The latest has been a technical mistake – the relationship of CPWP to the League Table is not an R Squared number (Coefficient of Determination) it is an R number (Correlation Coefficient).
For the stats followers that may be an issue… but even with the Modernized TSR (read here) the CTSR “R” is still generally lower (team to team) and certainly lower (table to table) than CPWP – meaning there still remains room for both statistical analytical approaches in a gmae that is played across the world…
Also, my thanks to some great research by Rob Lowe, a mate with the same passion for footy, who has asked to collaborate with me in the future. He has done some additional regression analysis on the data points of PWP with respect to goals scored and points earned. I should point out that his results show that not all six of the data points in the PWP equation independently-directly relate to goals scored or points earned. For me that is okay – and actually great news for a few reasons…
- Both of my two new statistics (Passes Completed in the Final Third per Passes Completed across the Entire Pitch – Step 3 of PWP) and (Shots Taken per Completed Pass within and into the Final Third – Step 5 of PWP) did statistically relate to Goals Scored and Points Earned (independently). Meaning those new statistics are relevant – both within the context of PWP and outside the context of PWP. It’s this statistical regression type information that should solidify these two new statistics in the world of soccer.
- For both Possession (Step 6 of PWP) and Passing Accuracy (Step 5 of PWP) – as you will see a bit later – those two derived data points were never supposed to directly (independently) relate to goals scored or points earned as a matter of course I have advocated for quite some time that they shouldn’t. PWP was built with the intention that the six derived data points only needed to relate to each other in a stair step relationship recognizing that in every game a team needs to possess the ball, move the ball, penetrate the opponent’s final third, take shots based upon that penetration, put them on goal, and score goals – all while preventing the opponent from doing the same thing.
- Another view on the outcome that Rob has noted – it’s unreasonable to analyze a game of soccer without taking those activities into account. Rob’s positive feedback was that both possession and passing accuracy act as a “smoothing agent” within the Index – I agree but with beginning to learn the nuance of writing an Academic Paper I would put it this way.
- Possession and Passing Accuracy stats have limitations when vewing overall regression analysis relative to goals scored and points earned – but those limitations actually give the overall analyst of soccer a much better understanding about the context of activities that occur when a team is performing better than another team.
- In addition, Passing Accuracy statistics provide a coach a great measurement tool for how well some players may develop and progress into higher levels of competition – to exclude data of this import really ignores some of the most fundamental training aspects a team needs to do in order to improve.
- Also, there is excessive volatility in the percentages associated with Shots on Goal versus Shots Taken and Goals Scored versus Shots on Goal – if I only look at those two things then evaluating a game is all about (pass-fail) – granted winning and losing is pass-fail. But to develop a “winning culture” a grading system perhaps more appropriate is A-B-C-D-F – in other words there are levels of success above and beyond pass-fail – especially when you are a team that isn’t at the very top of the league.
- By having Possession and Passing Accuracy in the equation you get a much larger (explanatory) picture on the culture of success – and as things appear to take shape, the Index itself, gives better clarity to that level of success for teams that are mid-table as opposed to bottom dwellers or top performers…
Now for the grist in Europe – first up – England:
Note that the first two diagrams (in each four diagram grouping) highlight where the highest quantity and highest quality occurs within each competition – after some growing pains (earlier Expected Wins measurements) all four competitions now see the teams that win having the highest averages, in all categories, for both quantity and quality… proving (for the most part) that more is better and more results in more…


All told the correlation, at this time, remains very strong – note that the “R” has replaced the “R2” in my third and fourth diagrams.
If I remove Possession and Passing Accuracy from the CPWP Index – the R value drops to .78 – statistically reinforcing that the Index, itself, better represents the standings in the League Table by including Possession and Passing Accuracy data. Proving yet, another way, that goals scored and shots taken simply do not provide adequate depth on what activities occur on a pitch relative to earning points in the League Table! And if you’ve read Moderning TSR this doesn’t mean ATSR/DTSR or CTSR doesn’t have value – it does…
As things stand today Chelsea take the League and since Man City, Man United, and Arsenal round out the top four (different orders) in both CPWP and CPWP-PI I’d offer it’s those four that advance to the UEFA Champions League next year. The bridesmaid looks to be a two horse race (Spurs supporters may argue that) between Liverpool and Southampton.
Note that Southampton edges Liverpool in CPWP but that Liverpool edges Southampton in CPWP-PI – meaning when excluding Goals Scored – Liverpool has better quality than Southampton – so for Liverpool it’s more about converting Shots on Goal to Goals Scored – while for Southampton it’s more about getting clean sheets and scoring at least one goal; at least in my view – others may see that differently?
In retracing the earlier discussion on the data within the six steps of PWP – as you can see in both the first and second Diagrams (for all competitions) the Exponential Curve (Diagram 1) and well as Power Curve (Diagram 2) the stair step relationship between the data – point to point – are incredibly high… Even more intriguing is how close those “R2” numbers are for both winning, drawing, and losing… really driving home the point, in my view, just how small the margin of error is between winning, drawing, and losing.
For goals scored (for or against) we really are talking about 5 or 6 standard deviations to the right of the bell curve…
Germany:
Perhaps the most intriguing issue this year isn’t the FC Bayern story – it’s the lack of goal scoring in Borussia Dortmund – when viewing the CPWP Predictability Index clearly Dortmund is offering up all the necessary culture the team needs in order to succeed – with one exception – goal scoring…. wow!
Another surprise may be Wolfsburg I’d pick them, and Bayer Leverkusen to finish two-three in their League Table – both show pedigree in team performance both with and without considering goals scored…


Spain:


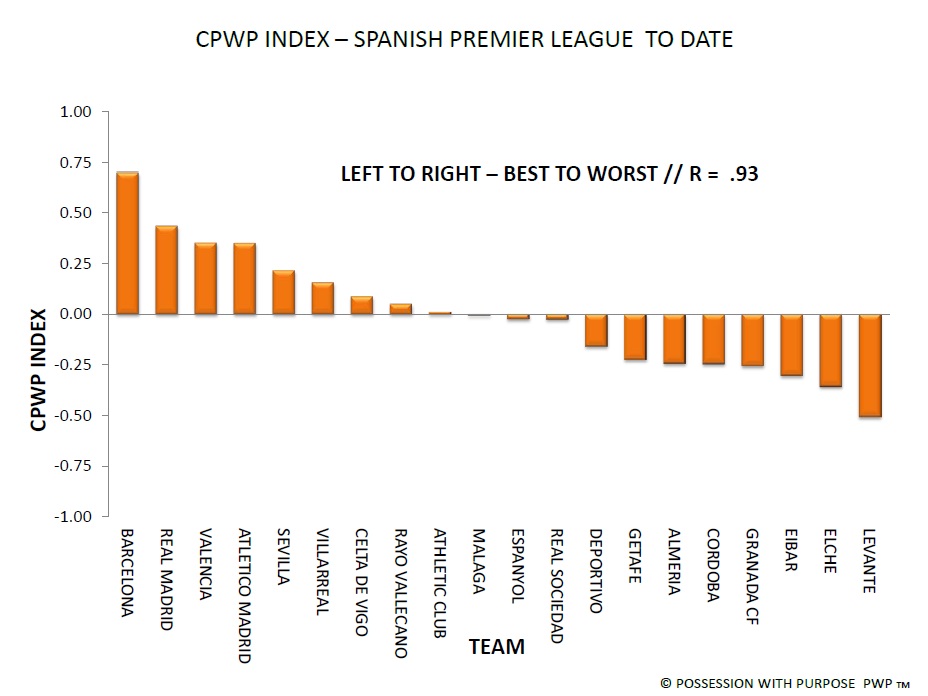

Barcelona and Real Madrid are locked in for the top team battle – my edge goes to Barcelona. I’d offer more here but I’m simply not up on the La Liga as much as I’d like to be…
UEFA Champions League:


The top eight teams that advanced are identified above – given the general success of CPWP relative to the top eight I’d expect FC Bayern Munich, BArcelona, Real Madrid, and Juventus to advance to the semi-finals.
In Closing:
My first of at least 4-5 Academic Papers is soon to be published – my thanks to Terry Favero for helping me work through this new experience – his support, patience, and knowledge in navigating all the nuance associated with writing an Academic Paper has been superb!
All four European competitions show more gets you more – this was not the case for Major League Soccer last year:


When more gets you more in MLS then I sense MLS has reached the BIG TIME – until then I think it’s a great breeding ground for Head Coaches that simply can’t get a job with a soccer club that has huge pockets of money.
Put another way – and many may disagree… I think a Head Coach who really wants to challenge their intellectual grit against another Head Coach can have greater opportunity to do that in MLS than they can by Head Coaching most clubs in Europe.
Why? For at least one reason – a Head Coach in MLS really has to do more with less…
Errata – the first MLS slide indicates 654 events – the correct number is 646 events…
Best, Chris
COPYRIGHT – All Rights Reserved. PWP – Trademark
Gluck: Fourth Year Anniversary Edition
My thanks to everyone who has supported my web site the last four years!
It’s been a learning experience for me and, I hope, for you too.
As the new year starts I’ve got at least five new articles planned; here’s a quick synopsis on what to expect:
- Following up on Coaching Youth Soccer Part I and Coaching Youth Soccer Part II, I’ll be offering Coaching Youth Soccer Part III – digging into which team statistics to use, why, when, and how to use them. For those who don’t know me these three articles highlight my coaching philosophy into one three word catchphrase “muscle memory mentality“.
- Two new individual soccer statistics: This (may?) be controversial – My intent is to submit two new, professional level, individual, soccer statistics that could transform the player market value system.
Said differently; are private statistics companies, like Prozone Sports, OPTA, and InStat (along with player agents) manipulating the player market value system by ignoring what might be the most logical, intuitive, individual soccer statistics ever?
- Expected Points – An updated version of my previously created Expected Wins series of articles. A follow on to what was offered at the World Conference on Science & Soccer 2017, Rennes, France.
- Expected Goals – A new way to calculate this over-hyped soccer statistic that brings it a bit closer to reality.
- World Cup 2018 Total Soccer Index; to include predicting the winners after round one is complete.
For now, in case you missed one or two, here’s my rundown on the top five articles in each of the last four years.
- 2014:
- World Conference on Science & Soccer 2014 – a power point presentation of what I offered as a guest speaker at this prestigious event. #2 All Time.
- Is European Football Really Higher Quality than Major League Soccer – a look at possession with purpose across Europe as compared to MLS. #5 All Time.
- On Fire – or Can’t Hold a Candle – Are Chicago Fire Burning at Both Ends – a look at Chicago Fire in 2014 and their woes in not winning.
- Possession with Purpose Revised Introduction – my second update to PWP; the most accurate, publicly generated soccer index. #1 All Time.
- Major League Soccer – Week 25 – Portland Finally Show Up
- 2015:
- Possession with Purpose Revised Introduction – two years running in the top five.
- Busting the Myth of Moneyball in Soccer Statistics – my take on the flawed reasoning that individual statistics actually add great value in evaluating player effectiveness. #6 All Time.
- Redefining and Modernizing total Shots Ratio – Debunking TSR – note this statistic has now been shoved to the side. #8 All Time.
- World Conference on Science & Soccer 2014 – two years running in the top five.
- Is European Football Really Higher Quality than Major League Soccer – two years running in the top five.
- 2016:
- US Soccer – Improving College Soccer in the United States – peeling back issues with College Soccer – a topic with a very high visibility rate now. #4 All Time.
- Moneyball 2 – Soccer Statistics Taking it to the Next Level – thoughts and ideas about the next iteration of individual soccer statistics. #7 All Time.
- Training Soccer in America – God Smackingly Obvious Or is It – my first article highlighting my frustrations with US Soccer Youth Development – a topic with a very high visibility rate now.
- Busting the Myth of Moneyball in Soccer Statistics – two years running in the top five.
- Possession with Purpose Revised Introduction – three years running in the top five.
- 2017:
- Porter Pulls out of Portland – Caleb Porter resigns. #3 All Time.
- Updated Possession with Purpose – four years running. Update includes a revision to my Total Soccer Index. Two new algorithmic revisions have the correlation (r) to points earned in the league table exceeding ‘goal differential’; the benchmark statistic of modern day soccer.
- Getting Hot in Portland – On a poor run, Portland Timbers head coach, Caleb Porter publicly humiliates some of his players during post game press conferences – the first article in America projecting he may be out by the end of the season.
- Portland Timbers hire Gio Savarese – Caleb Porter’s replacement; no frills from an MLS shill here – let’s wait till the end of year 1 before drawing any conclusions or over-hyping what he offers.
- It’s not just US Soccer that Needs to Wipe the Slate Clean – The first article offered in the US Soccer media environment that publicly slams mainstream soccer media for inadequate journalism – a topic with a very high visibility rate now.
In Closing:
- I called for Jurgen Klinsmann to be sacked after WC 2014 because his tactics and in-game adjustments weren’t up to snuff. Three years later the rest of the american mainstream soccer media world agreed and Klinsmann was sacked.
- I called for Sunil Gulati to be ‘ousted’ after WC 2014 because his leadership in helping youth development and head coach selection weren’t up to snuff. Three years later the rest of the american mainstream soccer media world agreed and Gulati is out.
- In hindsight – I wonder where we’d be in youth soccer development if we’d have made those decisions three years ago?
- No, I do not favor Caleb Porter as the next US Men’s National Team head coach. I like Caleb, he’s a stand-up guy and always took time to share and listen. That said, in my opinion, he’s not (consistently) good enough at reading in game situations and making tactical adjustments that lead to better performances; the exact same issue I had with Jurgen Klinsmann. .
- I’m hopeful either Eric Wynalda or Steve Gans are elected as the next United States Soccer Federation President; electing Kathy Carter is a NO-GO in my view as there’s perceived ‘collusion’ between MLS and SUM. As a retired Air-Force veteran perception is reality until proven otherwise – some may disagree?
I wish you all the best for the new year.
Best,
Separating winners from losers in Major League Soccer…
We are past the halfway point in Major League Soccer this year and if you recall from this previous article I promised I would revisit my Expected Wins analysis again at about this stage.
To continue to chart the progress of PWP, to include the data points behind the calculations, I am offering up some diagrams on what the data looks like after:
- The 92 game mark of the MLS Regular Season (184 events).
- The 183 game mark of the MLS Regular Season (366 events).
- The same data points for World Cup 2014 (128 events).
For background details on Possession with Purpose click this here.
To begin…
A reminder of how things looked after 184 Events (92 Games)…

Trends indicated that winning teams passed the ball more, completed more passes, penetrated the final third slightly less but completed more of their pass attempts in the final third.
For shooting; winning teams shot slightly less by volume but were far more successful in putting those shots on goal and scoring goals.
For details you can enlarge the diagram and look for your specific area of interest.
As for how the trends show after 366 Events (183 Games)…

Winning teams now average less pass attempts and complete slightly fewer passes.
There is a marked decrease in pass attempts into the opposing final third and slightly fewer passes completed within the final third.
In other words – teams are counter-attacking more and playing a style more related to ‘mistake driven’, counter-attacking, as opposed to positive attacking leading into the opponents final third.
As for shooting; winning team are now taking more shots, with more of those shots being on goal and more of those resulting in a goal scored.
In my opinion what is happening is teams are taking advantage of poor passing accuracy to generate and create turnovers .
In turn those turnovers are generating cleaner and clearer shots given opponent poor positional play on the transition.
My expectation is that more teams will now begin to focus on bringing in newer players that have better recovery skills and can defend better.
In contrast, here’s how these same data points look after completion of the World Cup of 2014… there is a difference…

Winning teams average more passes attempted and far more completions than losing teams.
In addition winning teams penetrated far more frequently than losing teams, and that increase in penetration also translated to an increase in passes completed within the final third.
With respect to shooting; winning teams shot more, put more shots on goal, and scored far more goals.
Clearly what we see here is that quality in player skill levels also translated to an increase in quantity.
That should become even more apparent in looking at the PWP outputs for MLS and World Cup Teams…
Here they are for MLS at the 184 Events point this year:

A quick review of the data outputs shows winning teams averaged 51% possession and are 2% points better in overall passing accuracy.
That passing accuracy advantage also carried into the final third but when taking shots losing teams averaged more shots taken, per penetration, than winning teams.
Bottom line here is that winning teams had those fewer shots taken generate more shots on goal and more goals scored than losing teams.
After the 366 Event point this is how those same outputs look…

Like the indicators, in the PWP Data points, the percentages here are beginning to reflect the counter-attacking style of football taking over as the norm.
Winning teams now, on average, possess the ball less than their opponents… wow… mistake driven football is taking hold across the MLS.
As for Passing accuracy within and outside the final third…
Winning teams continue to be better in passing – and that level of accuracy is driving a large increase in shots taken, per penetration, by winning teams compared to losing teams (almost 2% different).
That is a marked difference (4% swing), from earlier, where losing teams shot more frequently, per penetration, than winning teams.
In addition that increase in shots taken, per penetration, also results in more shots on goal, per shot taken, and more goals scored, per shot on goal.
The margin between winning teams, and losing teams, for goals scored versus shots on goal, at the 184 Event point versus 366 Event point, still remains > 29%.
So how about teams in the World Cup???

Like earlier, winning teams not only passed the ball more frequently they possessed the ball more, by 5% (52.56% to 47.89%).
So contrary to what others might think – tika-taka is not dead, it’s just been transformed a wee bit…
With respect to passing accuracy…
I’m not sure it can be any more clear than this – winning teams averaged 82.40% and losing teams averaged 80.46%.
What makes these outputs different from MLS is that the level of execution is far higher in passing accuracy; by as much as 6%.
To put that in perspective; if a team looks to attempt 500 passes in MLS that equals 380 passes completed – compared to 412 passes completed by World Cup teams; clearly the level of execution is much higher.
That difference of 32 passes completed can have a huge impact when penetrating and creating opportunities within the final third.
What makes it even tougher is that the quality of defenders is significantly higher at the World Cup level as well.
With respect to penetration and creation within the final third…
World Cup winning teams averaged 2% greater penetration per possession than winning teams in the MLS.
By contrast World Cup winning teams generated fewer shots taken per penetration than those in the MLS.
Does this speak to better defending? I think so…
What I think is happening is that quality gets the team into the box, but then the quality of the defenders and goal keepers, in that confined space, is taking over.
This should be evident, even more so, when seeing that winning teams in the World Cup also put fewer shots on goal per shot taken than winning teams in MLS.
And that also translated to goals scored for winning teams in the World Cup also scored fewer goals scored per shot on goal…
In closing…
All told, winning teams in the World Cup displayed slightly different (average percentages) than winning teams in MLS with one exception – passing accuracy.
And given the importance of the tournament it’s no wonder…
Without having the data, yet, I’d expect that the better teams in the EPL, Bundesliga, and other top European Leagues that difference in passing accuracy would remain.
As for the difference in possession (winning teams clearly possessing the ball more than losing teams) I’m not sure – mistake driven football, if memory serves is an approach Chelsea have used in the past…
I’d imagine it’s a pendulum type effect – as more teams work towards mistake driven football more teams will strengthen their ability to recover and open the game up a bit with direct attack to force the opponent from pressing so high.
I’ll be looking for additional trends as the year progresses to see if direct play increases – perhaps a good indicator of that might be even fewer penetrations and more crossing?
With respect to statistical relevance of the data and the outputs generated…
In every case the relationships created, be them Exponential or 4th Order Polynomial all had correlations that exceeded .95.
In other words the variations are minimal and should really reinforce just how tight the difference is between winning and losing in a game of soccer…
Best, Chris
Re-tweets appreciated…
COPYRIGHT, All Rights Reserved – PWP, Trademark
You say you want a Revolution – A different angle on PWP and Team Performance
A superb run with five wins and a draw in six games; by most standards that is a compelling argument for consistency. I agree and their overall Composite Possession with Purpose Index rating continues to climb.
They’ve (New England) climbed from 17th in PWP (week 5) to 7th after week 11; a superb shift of 10 full places in 6 weeks.
So in considering this giant push forward I’d like to take a different approach in how the data points from PWP can be viewed.
This is new so please bear with me for a minute or two as I set the context.
Below are a number of diagrams referencing my PWP indicators for a few teams; the diagram being used this time is the ‘doughnut’ diagram from Microsoft Powerpoint.
The interesting thing about this diagram is that it allows me to offer up a view on my PWP data points that isn’t relative to the exponential relationship (a line). Instead, it allows me to picture the overall tenor of PWP data points in relationship to themselves as being a part of a ‘whole’; with the ‘whole’ being PWP.
I feel confident I can take this approach since my Expected Wins 2 correlation for my data points is ~.97 (R2) — as near to rock solid as you can get.
Other context points include:
- The teams used in this analysis are Seattle, New England, Montreal, Portland and last years’ Supporters Shield winner (New York) plus last years bottom dweller (DC United)
- Reminder in case my explanation was a bit wordy above – the percentages indicated in the doughnut are not the percentages of those activities relative to the game; they are the percentage of those activities relative to each other with 100% being all those activities added together.
- Source – as usual the MLS Chalkboard and the MLS Statistics Sheets
- Gold Stars on the diagrams are intended to show you where differences occur.
- The team name on the outside of the doughnut is the outer ring of data and the team name on the inside of the doughnut is the inner ring of data.
To begin…
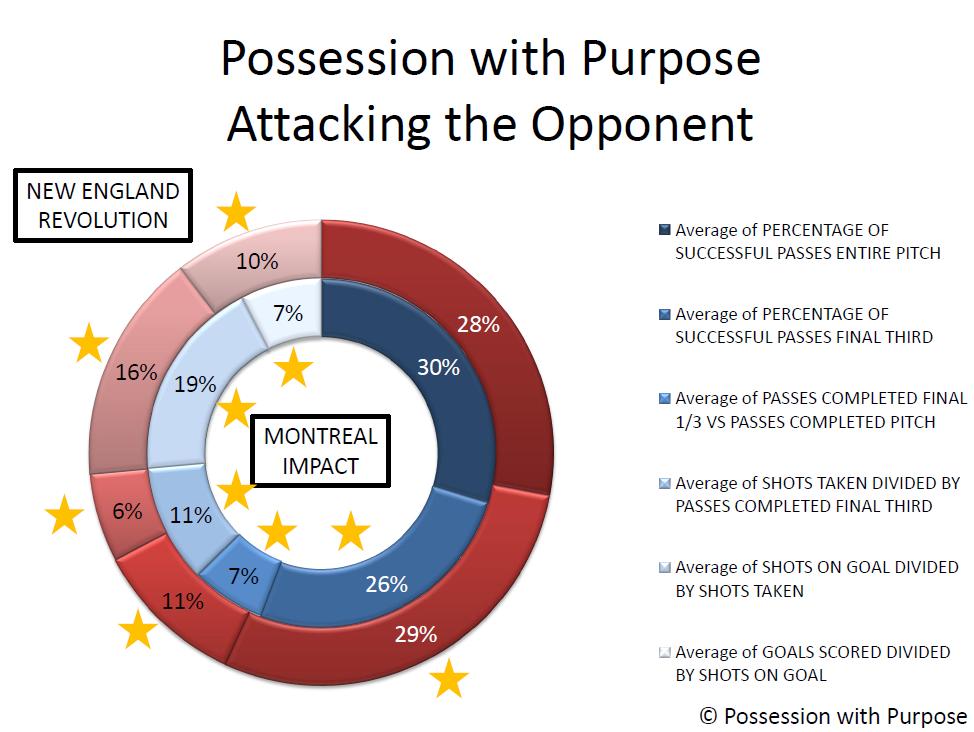
PWP Doughnut Diagram Week 11 NER v MIFC
The volume of Final Third passes successfully completed by New England (29%) is 3% points higher than Montreal (26%). Note also that Montreal has a greater percentage of PWP outside the Final Third (30%) than New England (28%). Both of these indicate to me that New England is more focused on penetrating and creating than Montreal.
For the future I will check into these three areas when looking to see if a ‘direct attacking approach’ can be better differentiated from a ‘ground-based’ (short passing scheme) approach.
The actual volume of penetration is higher for New England as well (11%) versus (7%). And like my regular PWP analysis the data here also supports the fact that teams who are more patient in creating shots taken (6% for NER versus 11% for MIFC) end up with more goals scored.
I did ask Matthias Kullowatz about the specific shot data for New England and Montreal; ~60% of Montreal’s shots on target have come outside the prime scoring zones 1 & 2 while ~68% of the Revolution shots on target have also come outside of zones 1 & 2. So what’s different?
I think it’s down to time and space again; though it could be the Revolution have better strikers – but when you see the DC United doughnut diagram a bit later I think it’s back to time and space; and with fewer shots taken and more patience in the final third that seems reasonable to me.
Now for a contrast that might be better at explaining individual mistakes and bad fortune more than a bad ‘style/system’…

PWP Doughnut Diagram Week 11 SSFC v PTFC
Notice no ‘gold stars’; why? Because there really isn’t that much difference between how these two teams execute the six steps of PWP.
What separates these two teams in the league table are individual mental mistakes in defense – Portland sit on ten points while Seattle have 25. Through the course of this year the Timbers have dropped 7 points due to red cards and penalties – they did both against Columbus Saturday night!
In considering the ‘sameness’ of the data I expect as time passes an output similar to this could highlight ‘individual mistakes’ and perhaps ‘good/bad luck’ when it comes to rebounds and deflections – again recall Saturday night when Futty Danso deflected a shot and notched an ‘own-goal’
All told things went pretty well for Columbus, a red card by their opponent, a foul in the penalty box by their opponent for a PK and a deflected own-goal by their opponent. If I were a Columbus fan I’d be pretty pissed they didn’t win – bad luck for the Crew!
However viewed I’ll revisit this diagram later when the Cascadia Cup battle heats up.
So here’s the doughnut view of New York compared to DC United last year and then a bit further down how they look compared to each other this year.

PWP Doughnut Diagram NYRB v DCU 2013
First off – let’s not forget Ben Olsen was not fired and perhaps this doughnut diagram can also help explain why given the overall poor performance in results last year for DC United.
Notice that the team does exceedingly well in comparison to New York with respect to Passing, penetration and creation; they actually exceed New York in the first two categories and only fall off when it comes to goals scored (7% for DC United versus 15% for New York).
So I’d offer that the system Ben Olsen ran last year worked – what he lacked was a pair of good strikers. And if you recall the Montreal doughnut earlier the outputs from DC United do not mirror those of the Impact!
They added Espindola and Johnson and shored up their defense a bit; that also included adding Amos Magee to the staff. Remember him as the Defensive Coordinator for Portland last year (I think – others can confirm or deny that I’m sure)
Bottom line here – the system didn’t change and the Head Coach didn’t change and I’d offer that was appropriate… now for the same diagram this year:

PWP Doughnut Diagram Week 11 NYRB v DCU 2014
In closing:
Note the increase for DC United in the final category – goals scored versus shots on goal – pretty compelling information to reinforce that the system used last year is the same system used this year and the difference – major difference – is the addition of two quality strikers.
I’m just in the learning stages on how this new doughnut diagram will take shape – I’m pretty sure it will have at least one hole in it – I’m hopeful there aren’t a lot more.
Some changes afoot with OPTA and MLS – I see OPTA incorporated the Final Third Passing Accuracy suggestion – just need to find out if crosses are included in that metric???
As for the new MLS Chalkboard – I’m not sure how that will work if the ‘numbers’ of activities are not available to count when it comes to defensive activities and ‘touches’ for players…
And yes, the old Chalkboard still appears to exist given a separate link within previous articles but it’s unclear if this change will be a permanent change for next year – or even the World Cup for that matter…
As for This Week in PWP; if you saw my tweets yesterday you know the top Attacking and Defending PWP teams of the week; New England in attack and Toronto in Defense with the Reds taking the Composite PWP Index top spot for Week 11.
Sporting KC, along with LA Galaxy remain atop the Composite PWP through Week 11 while the Revolution moved to 7th and Columbus dropped to 4th as Real Salt Lake are now in a comfortable position of 3rd best overall.
Finally, this view also gives you and idea of what percentage each team gleans from each of the PWP Six Steps data points in the calculation for the overall Index number.
Best, Chris
MLS Coaches – Leveraging Possession with Purpose to Analyze Coaching Performance
I promised this year, at various times, to offer some thoughts about how Possession with Purpose can be used to support analysis on how well Head Coaches might be performing compared to others.
As a reminder from last year; five of the bottom six teams in my PWP Composite Index had coaching changes, Columbus, Chicago, San Jose, Toronto, Chivas USA, and then after an early exit from the Playoffs; Montreal. Other teams making changes included Vancouver, Colorado and FC Dallas and the depature of Kreis for NYCFC. All told, a total of 10 teams made changes in Head Coaches for one reason or another.
Will this year have similar results, and if so, who? I don’t claim to prognosticate coaching changes and the firing of Head Coaches, but changes happen, and last year’s information, relative to the bottom six teams in my Composite PWP Index, is pretty compelling at first glance.
So after reading an article offered up by Jason Davis at ESPNFC “Three MLS coaches on the hot seat,” plus releasing my article earlier this week on Crosses offered in MLS, I figured the timing was pretty good for my first installment.
Here’s some of my initial information for consideration on “system of attack”:
- For home games Frank Klopas, Mark Watson and Frank Yallop-led teams are the top three in MLS that offer up more crosses per pass attempted in the final third.
- For away games Klopas, Watson, Yallop and Wilmer Cabrera-led teams are the top four teams in MLS that offer up more crosses per pass attempted in the final third.
- The relationship of taking points, at home, in the MLS is (-.70) for teams that cross the ball more frequently than others. In other words, the teams who cross the ball the most are more likely to lose points (at home) than teams that don’t.
- The same relationship of taking points in away games holds as well (less at -.37). but still the same logic – the more crosses a team offers in away games the more likely they are to drop points.
- Bottom line is these four teams are less likely to win at home or on the road given their current system of attack in the Final Third.
In other words, these teams led by these head coaches use a system of attack that simply doesn’t get positive results on a regular basis in MLS; or… these teams, led by these head coaches and general managers don’t have the right players to execute that system of attack in MLS.
So how does Sporting KC do it? They are a team that offers up the 7th-most crosses at home and the 5th most crosses on the road, yet they are winning using that system of attack.
Why? I think it’s because their GM and head coach, collectively, are getting the right players to play to that system of attack.
So how about overall Team Attacking and Defending performance (Team Positions in my Composite PWP Index) after nine weeks in: (1) Possession, (2) Passing Accuracy, (3) Penetration into the Final Third, (4) Creating and Taking Shots, (5) Putting Shots on Goal, and (6) Scoring Goals?
After Week nine, four of the five worst performing teams in MLS, in these categories are:
- Chivas USA (19th out of 19),
- Montreal Impact (18th out of 19),
- Chicago Fire (17th out of 19), and
- San Jose Earthquakes (15th out of 19).
In case you missed it in an earlier article on Expected Wins 2 – the correlation of those data points as a whole is .99 (R-squared); the closer to “1” the better and stronger the relationship.
In other words that means that the relationship of those data points is pretty much rock solid, and that it’s a worthy indicator (outside of points in the league table) for objectively evaluating team (attacking and defending) performance.
So while Jason Davis indicates John Hackworth and Caleb Porter as being potential candidates for hot seat discussions, actual evidence available indicates those names don’t belong there. Indeed, there are other teams performing, as a whole, much worse than Philadelphia or Portland.
Three teams performing worse at this time include Chivas USA, Houston and Toronto, while Vancouver is behind the power curve compared to Philadelphia and slightly ahead of Portland. By the way, this is not to say John Hackworth might not belong in a list a bit later this year – but for now I think it is highly speculative to even put in print that he’s a potential hot seat candidate.
And with respect to Caleb Porter – it does seem, at times, that writers outside of the Portland area speculate and use the Timbers large supporter base to artificially increase readership in some of their articles… just saying. As a writer covering the Timbers here in Portland, reading the idea that Caleb Porter is on some sort of hot seat is (softly voiced) bollocks. But that’s just me…
In closing:
Given the evidence offered, does it seem reasonable that those four Head Coaches and their associated GM’s are worthy of a “Hot Seat” distinction? I think so…
Winning styles come in all shapes and sizes – the critical piece is having the right players to support that effort, and the time to install the system. Klopas, Cabrera, Yallop and Watson all know more about football than I do.
And it’s not my place, nor is it the place of any soccer writer (in my opinion) to pass judgment on whether or not someone should get fired or hired.
But… objective evidence indicates that those four teams, compared to others, lack an effective attacking system of play, lack strong overall team performance in attacking and defending while also lacking the most important measuring stick – points in the league table.
I’m sure this is not new, nor rocket science, to those head coaches, general managers, or owners… but… (perhaps?) it is helpful to others.
Best, Chris
You can find Chris on twitter @ChrisGluckPWP

Possession with Purpose is Published
Possession with Purpose analytical approach is published!
Four years ago I began a journey blogging about the Portland Timbers.
Part of that journey included speaking with Caleb Porter, and others, about my new analytical approach to measuring team performance in soccer.
For those that have followed my journey (that continues) my thanks.
To those that have supported me through comments and sharing/learning my thanks.
For me, I never envisioned my own approach being discussed at this level – I only hope it can continue to add value in helping others understand how this complex sport is really quite simple.
You either have possession of the ball with the intent to possess or penetrate or you don’t and your opponent does.
And if you don’t have the ball then your objective is to prevent your opponent from doing to you what you want to do to them.
There is much more to PWP than what is offered in this book.
If you haven’t read this article – providing links to other relevant PWP articles – than I suggest you take a few days, yes days, to glean through all the material.
Perhaps it may add value to you watching, coaching, playing, or analyzing the game of soccer?
What to watch for on my site in the future:
- MLS weekly analysis
- MLS season progression analysis
- Expected Wins 5 – an update including information from the Women’s and Men’s World Cup, EPL, Bundesliga, LaLiga, and MLS (2013 – 2016)
- Soccer and Moneyball type statistics Part II – a deep dive into the useless and (perhaps?) useful world of individual statistics.
- What we have available in the public domain versus what isn’t available,
- Two styles of play – not eight as prescribed by Prozone Sports,
- Keeping measurement of the game simple, And
- Real time indicators that can significantly impact individual statistics that aren’t measured.
Best, Chris
COPYRIGHT, All Rights Reserved. PWP – Trademark

Expected Wins 4
Republication/update: My intent, this past year, was to update my series on Expected Wins, with EW-5 – that has changed. After conducting research and analyses, and seeing my work published in London, England I’ve decided to rename this series Expected Losses instead of Expected Wins.
- Why, because my data analyses is beginning to show it’s easier to track and predict losses as opposed to ‘draws’ or ‘wins’.
But to sustain the integrity of the ‘thinking process’ I’m only going to edit the first part of this article and remind folks about the previous research published:
- Expected Wins Original – Published April 2014
- Expected Wins 2 – Published May 2014
- Expected Wins 3 – Published September 2014
What follows is the original, unedited post offered in November of 2014. I think if you read this article below you may find it striking given the current conditions with US Soccer and the US Men’s National Team!
Jurgen Klinsmann made a statement the other week about his preference that players working to make the USMNT play in Europe not in America.
Lots of hoo-haw followed with opinions being thrown out there by just about everyone.
As far as I know no-one has, as yet, come up with a way to quantitatively measure which league, leagues, or competitions are higher quality.
This is my attempt to do that using my Possession with Purpose Analysis.
Be prepared for a few charts – sorry – it is what it is and a statement like Klinsmann’s deserves to have some quantitative analysis thrown towards it.
Finally, if you missed Expected Wins 3 here is a link to give you some history on this quantitative analysis.
Now for the grist, first the array of Expected Wins 4 diagrams for each league/competition I cover, Major League Soccer, English Premier League, La Liga, Bundesliga, UEFA Champions League, and the World Cup of 2014.
Major League Soccer – End of Season:
English Premier League after 240 Events (120 Games):
La Liga after 238 Events (119 Games):
Bundesliga after 214 Events (107 Games):
UEFA Champions League after Round 5 – 160 Events (80 Games):
World Cup 2014 – End of Competition:


 So what’s it all mean?
In each of the diagrams I highlighted in green the category that had the highest volume for all my PWP Data Points.
For example, just above, in the World Cup of 2014 the winning team had the highest volume of activity for every single PWP data point.
The same holds true for the UEFA Champions League, La Liga, and the English Premier League.
The conclusion here? Volume speaks volumes…
Greater numbers of passes both outside and within and into the Attacking Final Third (RESULT) in MORE Shots Taken, MORE Shots on Goal and MORE Goals Scored!
In the case of the Bundesliga (an oft mentioned counter-attacking league) it’s the losing teams that offer MORE Possession and MORE overall Passes but when it comes to the Attacking Final Third it’s the winning teams who do MORE with MORE!
With respect to the MLS – a contrast to be sure. MORE Passing outside and within, and into, the Attacking Final Third gets you LESS when it comes to Shots Taken, Shots on Goal, and Goals Scored.
Why is that?
I’d offer it’s down to playing a game that has less overall ball control from the players – in other words there is less quality on the pitch to take advantage of the MORE for MORE systematic outputs we see from all the other leagues/competitions; others may have a different view.
For me, this is an early indicator that what Jurgen Klinsmann offered is quantitatively accurate!
Before moving on here’s how all the leagues and competitions compare to each other in one diagram for winning teams:

The UEFA Champions League leads all competitions/leagues in the average volume of Passes Attempted, Passes Completed, Passes Attempted within and into the Final Third, Passes Completed within and into the Final Third, Shots Taken, Shots on Goal, and Goals Scored.
If volume of activity (were?) to be a quantitative measure of quality then it’s pretty clear the UEFA Champions League HAS the highest quality of all these competitions.
And what teams comprise the UEFA Champions League? Teams from Europe…
But there is more to Possession with Purpose than just volume; here’s how the PWP Data Relationships show:
In looking at the percentages here’s where it gets interesting – and reinforces what I’ve felt and thought all along, patience in creating time and space in the Attacking Final Third has value.
In terms of Possession Percentage, Passing Accuracy across the Entire Pitch, and percentage of Penetrating Possession within and into the Attacking Final Third the UEFA Champions League, again, exceeds all other competitions.
Where the patience virtue comes in is when it comes to the percentage of Shots Taken per Penetrating Possession – the UEFA Champions League is lowest (14.98%).
So in returning back to the volume of Shots Taken per penetrating possession.
The UEFA Champions League has the highest volume of Shots Taken but the lowest percentage rate.
So even with the third worst percentage of Shots on Goal per Shots Taken and the second worst percentage of Goals Scored per Shots on Goal this competition still has the highest volume of Shots on Goal and Goals Scored.
For me this is another quantitative means to substantiate what Jurgen Klinsmann offered about encouraging Americans to get better by playing in Europe.
In Closing:
Questions?
Is it better to play on a winning team in a league where there is less overall control of the ball, on the pitch for 90 minutes?
Or is it better to play on a losing team (for 90 minutes), against top quality players, in a league where there is superb control of the ball across the entire pitch for 90 minutes?
Which competition forces you to concentrate more recognizing that the smallest positional error will completely punish your team?
In other words…
If you were a good player and you wanted to get better, would you prefer to play in a league where there are fewer passes and a more wide open play that doesn’t stretch your talent to control the ball?
Or…. would you rather play in a league where the ball is zipping about (by over 100 to 300 passes more) forcing you, in turn, to zip about yourself to try and better manage that game yourself with your teammates?
Answer:
If I were a player in today’s market there is simply no need to consider answering that question any further – I’d play in Europe OR at least strive to play in Europe!
How about you?
If you’re new to Possession with Purpose and this analytical approach read here for an introduction.
By the way – even if you feel or think you don’t need this type of data to substantiate which leagues or competitions are better today – it will provide a great benchmark in looking at how the future takes shape in MLS.
Best, Chris
COPYRIGHT, All Rights Reserved. PWP – Trademark
You can follow me on twitter @chrisgluckpwp
Malaga and Almeria – Two Teams going in Different Directions?
My next installment on La Liga takes a look at Week 12 and compares how things have progressed or digressed for teams since Week 6.
If you’ve not followed my Possession with Purpose analyses in the past here’s a quick link to an Introduction.
Some movers to be sure, so to give the Index some context here’s a quick look at the League Table after Week 12 alongside Week 6:
 The biggest movers up the League Table have been Malaga +8, Athletic Club +7, Levante +5, and Real Madrid +4.
On the down side both Almeria and Granada CF dropped six places, while Real Sociedad (and their new Head Coach David Moyes) dropped four, and Celta de Vigo, with Espanyol dropped three.
Now for the CPWP Strategic Index after Week 12; followed by how things looked at Week Six:

Now Week Six:

As a reminder, the CPWP Index does not react as quickly as team changes in the League Table – it’s a wee bit slower and more subject to change based upon a consistent change in team performance.
That being said Malaga (who moved up eight positions in the League Table) is 6th in the CPWP Index after Week 12 compared to 11th after Week six.
On the negative side Almeria (who has dropped six places) was 10th after Week six but is now 16th in the Index.
A solid indicator, again, that the Index will keep up with team changes in the League Table.
So what has happened, PWP wise, for Malaga and Almeria that may help us better understand their significant moves in the League Table?
To narrow the scope here’s the APWP Strategic Index for Week 12 followed by Week Six:

 For Malaga, Week six indicates their overall APWP was 18th worst – now in Week 12 it indicates Malaga’s APWP is 8th best.
A shift of ten positions – it’s likely some attacking indicators have improved – but I’ll check the DPWP too before choosing which to peel back.
As for Almeria, Week six shows them 13th best, while Week 12 shows them 16th best.
Not that much of a change, so perhaps it’s the DPWP key indicators? Let’s see.
DPWP Strategic Index after Week 12 followed by Week Six:

 For Malaga they were 5th best in Week six and are 5th best after Week 12; clearly the change in team performance rests with the attacking side of the game.
For Almeria they were 8th best in Week six and are now 14th best, for me that means it’s their DPWP key indicators that have taken a nose dive.
So the grist for Malaga in the APWP Key Indicators:
Possession Percentage:
Week 12 48.46% / Week 6 48.84% (no real change)
Passing Accuracy:
Week 12 73.76% / Week 6 72.09% (about 2% increase in Passing Accuracy)
Penetrating Possession:
Week 12 27.53% / Week 6 25.46% (about a 2% increase in Penetrating Possession)
Shots Taken per Penetrating Possession:
Week 12 16.65% / Week 6 19.07% (about a 3% decrease in Shots Taken per Penetrating Possession)
Shots on Goal per Shots Taken:
Week 12 31.02% / Week 6 25.68% (about a 6% increase in Shots on Goal per Shots Taken)
Goals Scored per Shots on Goal:
Week 12 37.40% / Week 6 16.67% (about a 17% increase in Goals Scored per Shots on Goal)
Attacking Summary:
I’d offer Malaga are playing shorter, quicker passes in order to gain penetration – while at the same time they are taking a wee bit more time to be selective in their shots taken.
The resulting outputs clearly indicate that this tactical change has led to more shots on goal and far more goals scored!
And given that the percentage of possession has not changed – I’d offer they have not dropped deeper to cede possession – they’ve simply decided to be more patient in their penetrating attack.
It will be interesting to see if this pattern continues to hold true through the next six weeks.
In moving on to Almeria – a team I’ve looked at a few times this year; here’s how their DPWP key indicators show what’s changed:
Opponent Possession Percentage:
Week 12 53.89% / Week 6 52.95% (about 1% increase in opponent Possession)
Opponent Passing Accuracy:
Week 12 76.35% / Week 6 77.92% (about a 1% decrease in opponent Passing Accuracy)
Opponent Penetrating Possession:
Week 12 24.34% / Week 6 23.96% (about a 1% increase in opponent Penetrating Possession)
Opponent Shots Taken per Penetrating Possession:
Week 12 19.40% / Week 6 20.44% (about a 1% decrease in opponent Shots Taken per Penetrating Possession)
Opponent Shots on Goal per Shots Taken:
Week 12 33.96% / Week 6 28.20% (about a 5% increase in opponent Shots on Goal per Shots Taken)
Opponent Goals Scored per Shots on Goal:
Week 12 33.43% / Week 6 22.69% (about an 11% increase in opponent Goals Scored per Shots on Goal)
Defending Summary:
There are minor changes in how the opponent performs against Almeria leading up to Shots on Goal and Goals Scored – at that point the success rate of the opponent jumps 5% and then 11%.
While that might not seem like that much of a change, leading up to Shots on Goal and Goals Scored, there are many times in this game where it only takes four or five more passes, that are accurate, to change the outcome.
Given that I’ll also take a look at the volume of opponent activity as well.
What stands out to me is this:
- In the last six games the opponent has averaged five more completed passes within and into the Almeria Defending Final Third.
- In turn, even with the exact same number of Shots Taken per Penetrating Possession, it’s led to the opponent averaging 5.67 Shots on Goal compared to 4.17 Shots on Goal the first six games.
- That change in volume of Shots on Goal as led to 1.50 Goals Against in the last six games compared to .83 Goals Against in the first six games.
- Another example, like what we’ve seen in Expected Wins, where the difference between winning and losing can be very small indeed.
Of course, what hasn’t helped is playing Barcelona two weeks ago – that being said – Almeria also gave up two goals to Elche, Villarreal, and Levante in this same six week span – so it’s not just down to playing Barcelona!
Best, Chris
COPYRIGHT, All Rights Reserved. PWP – Trademark
You can follow me on twitter @chrisgluckpwp
English Premier League – Mid-table Maidens or Muppets?
Like the La Liga article this week I’ll be taking a look at some mid-table maidens and muppets.
And yes, I’m breaking down this week and offering up some analysis on Manchester United.
I’ve delayed long enough I guess so I’ll take a peak at them along with Tottenham, Crystal Palace, West Brom, Stoke City, and Leicester City; all of them on eight points each working from 7th to 12th in the league table.
As usual – to start things my Possession with Purpose Composite PWP Strategic Index through Week 6:

In picking out those six teams Man United lead in CPWP (5th best); followed by Spurs (9th), Stoke (10th), Leicester City (13th), West Brom (14th), and Crystal Palace (16th); not bunched up like in the league table.
Perhaps there might be some telling team performance indicators in APWP or DPWP that really separate these teams?
The best way to start is to peel back all these teams in APWP:

The obvious – Man United rest 5th best, Leicester City, perhaps a surprise at 9th best (lest we forget that smashing pumpkin they delivered at Man United’s door two weeks ago), Spurs 11th best (or 10th worst), Crystal Palace 13th best, Stoke 15th best and West Brom 4th worst.
Now for the grist…

Here’s the six teams in focus plus two balancing agents – Chelsea and Burnley – the top and bottom of the EPL heap…
I could spend the better part of 800 words going over what’s offered here – I’d prefer not to and just point out a few bits and pieces before another diagram on Attacking.
- Leicester City (blue bars) have one hell of a great parabolic relationship (follows the white dashed parabola of Chelsea going on) – and Man United do as well. Not quite as pronounced as Chelsea but the pattern of attack is similar in team outputs.
- The difference there with Leicester City is obviously quality – less means less for the most part in the EPL – but all things considered not a bad form for Leicester.
- In considering Man United – plenty of patience (like Chelsea) but the finishing is getting in the way – perhaps Wayne Rooney is not the striker this team needs?
- Even more worrisome for Man United should be that they’ve played no-one of great concern in the EPL yet – they’ve got Everton next weekend then a potential break with West Brom (but maybe not?) then they have Chelsea and Man City back to back…
- When looking at the pear-shaped teams it’s West Brom, Spurs, and Stoke City who best follow the pattern (black dashes) set by Burnley.
- Crystal Palace look to follow the Chelsea parabola but appear to lack goals scored relative to the percentage of shots on goal – perhaps attributed to missing the near or far post? Still not bad form inside the 18 yard box.
- Those who chart Expected Goals will know that better than I.
In moving on to my Expected Wins Diagram; here’s the same teams viewing how those percentages of success translate to overall volume:

I’ve taken the liberty of highlighting Chelsea in light yellow while highlighting Burnley in light orange.
A few items of note here without 800 odd words of observations:
- Recall I mentioned that Crystal Palace was a bit lacking in goal scoring percentage compared to shots on goal – well in looking at all these teams, Crystal Palace average the lowest volume of activity in all these categories until – until – you get to Shots on Goal and Goals Scored… pretty remarkable and perhaps a great example of how an effective attacking performance plays out, statistically, for a team that plays more towards a counter-attacking style than a possession based style.
- I don’t offer Crystal Palace as being more direct given their lower volume of passes attempted in the Final Third – if their numbers were near Stoke City then I might.
- Note that Man United exceed all the others in this scrum by a good margin with one exception – Stoke City, who has a considerably less volume in passing but ends up with a higher volume of shots taken.
- In considering Stoke – note the drop-off in shots on goal and goals scored… even though they have the largest volume of shots taken for these teams.
- Perhaps this is another great example of a team that looks to play slightly more direct, has less patience on the ball, and as a result, their overall productivity takes a nose-dive when it comes to scoring goals?
- Oh – had to change the color for Chelsea to light blue given the white background…
I had a request earlier this week to offer up my Expected Wins diagram using a Logarithmic scale – as such I’ve included one below:

The highlighted areas remain the same – but with this approach you can clearly see the negative outcomes for Stoke City and Burnley – while also seeing that the overall data collection points do have a relationship.
The healthy one is clearly the light blue bar for Chelsea – and as noted in Expected Wins 3 – this league works off of volume with the exception of Final Third Passes Attempted… losing teams (now) attempt more passes into the Final Third – pretty much reinforcing that Direct Play just isn’t good enough to cut it in the EPL.
Moving on to Defending PWP:

Man United, Stoke, West Brom and Spurs are fall above the mid-table while Leicester City and Crystal Palace are near bottom; again they don’t really bunch up in defending team performance like they do in results.
In looking at the diagram below it’s a wonder Stoke City are as high up as they are – I’ll offer up where Stoke gets hit worst a bit later – for now notice that I’ve replaced Chelsea and Burnley with Southampton and QPR:

Measuring defending statistics is always hard to do because I have to intuit what doesn’t happen on the pitch; given the lack of clarity in separating passes and shots between those that are hindered and those that are open… more here on that if interested.
For now the juice in 800 words or less:
- A bad sign for me in how effective a team is, in defending their 18 yard box, is when the opponent percentage of goals scored, per shots on goal, exceeds the percentage of shots on goal, per shots taken.
- The team who best represents a lower percentage of goals scored per shots on goal than shots on goal per shots taken is Southampton – currently in second place; the White dotted line.
- At this stage their differential is 19.15% – second best is West Ham at 11.71% and third best is Swansea City at 9.22%.
- Of all the teams in this focus Man United has the best differential (+2.23%).
- The worst of the lot is Stoke City; a differential of -21.87%; the largest margin by far… either they need a new Goal Keeper or they need better fullbacks and center-backs…
- What keeps them on the higher end of the DPWP is lower percentages for their opponent in possession and shots on goal per shots taken – so they do a great job in looking to prevent the shots taken reach goal – but when they do reach goal they are high quality shots… I’d attribute this to poor positional play in the 18 yard box and perhaps goals conceded on the counter-attack.
- Either that or their Goal Keeper simply isn’t that good?
- As far as penetration goes, we already see Crystal Palace yields possession and space in the midfield – as do West Brom, Crystal Palace, and, for the most part, Leicester City.
- With higher opponent percentages in possession – coupled with a strong passing league, it’s no wonder when the defense breaks down in the 18 yard box those teams are going to be slightly less effective than someone like Southampton.
In closing:
It should be noted that only Crystal Palace and Leicester City are on the lower end of DPWP – so these teams can score and at this stage it’s their attack that is pushing them to mid-table – can that hold?
Hard to say – one thing is, neither of those teams is as pear-shaped as Newcastle…
Still early days yet but teams are showing tactical trends, seen before in PWP analysis, that separate the possession based teams with those who like to play counterattack or more direct.
Survival of the fittest couldn’t be more clear in this superb league… speaking of Newcastle; how on earth are they so low in the Table?
More to follow on that question in a couple of weeks.
Best, Chris
COPYRIGHT, ALL Rights Reserved. PWP – Trademark
Follow on twitter @chrisgluckpwp
